NBA Lineup builder & Organization Optimization Project
Optimizes NBA team lineups under a salary cap and allocates budgets across Stadium, Staff, and Team Performance. Provides interactive results and visual feedback using Java, Vaadin, and OR-Tools.
NBA Lineup Lab & Organizational Optimizer
Team Members: Erv Sanchez | Steve Abochale
Project Summary & Skills Used
Lineup Lab is a web-based basketball analytics tool that helps users build optimal NBA lineups from historical 2007–2015 data and allocate organizational budgets to maximize team performance and revenue. The system uses CSV player data, OR-Tools optimization, and a Vaadin interface. This project demonstrates Industrial Engineering concepts like resource allocation, optimization modeling, and decision support systems.
Key Skills Practiced: - Java programming: custom classes, ArrayLists, object-oriented design - File I/O: reading and parsing CSV files - OR-Tools: mixed-integer and linear programming - Vaadin: building interactive web pages and UI components - Collaborative development: team coordination - Data analysis: using player stats to guide decisions
Project Development Process
- Original Goal: Build a tool that simulates being an NBA general manager: select lineups under salary caps, and allocate budgets across stadium operations, staff, and team performance.
- Design Evolution: Started with a small prototype to test OR-Tools solvers, then implemented Vaadin UI for interactivity. Added progress bars to visualize budget allocation.
- Roadblocks & Solutions:
- Loading large CSV datasets = solved using DataLoader and TableSaw
- Vaadin UI crashes during early testing = solved by isolating functionality first, then connected UI
- Final Outcome: A functional decision support tool where users can build lineups, see projected team performance, and allocate budgets with clear visual feedback.
Key Features & Highlights
1. Lineup Optimization:
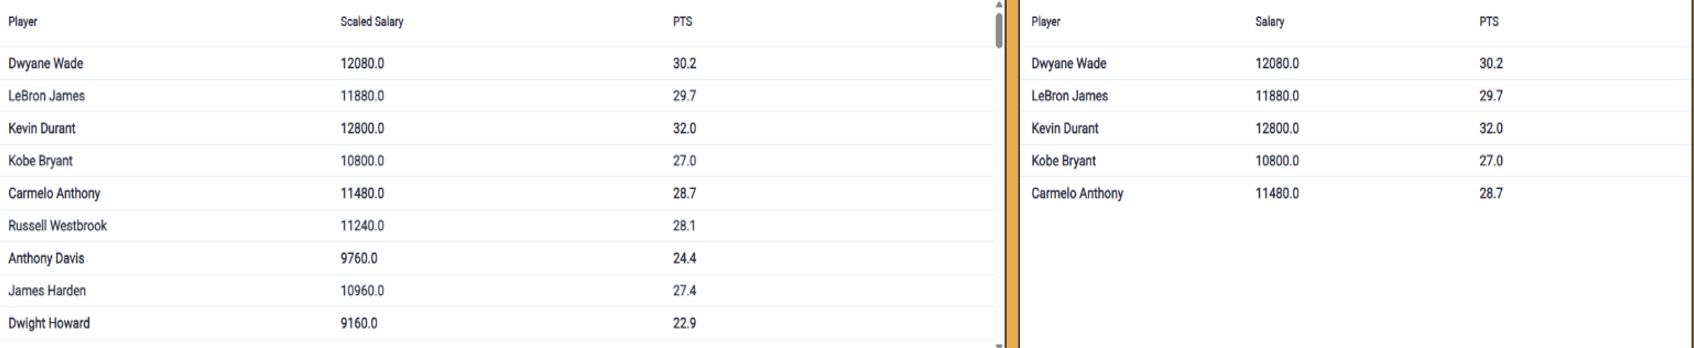
- Automatically selects the best 5-player lineup based on salary cap constraints and player performance.
- Uses OR-Tools mixed-integer programming for fast, efficient computation.
- Displays selected players and total performance in a clear Vaadin table
2. Organizational Budget Optimization:
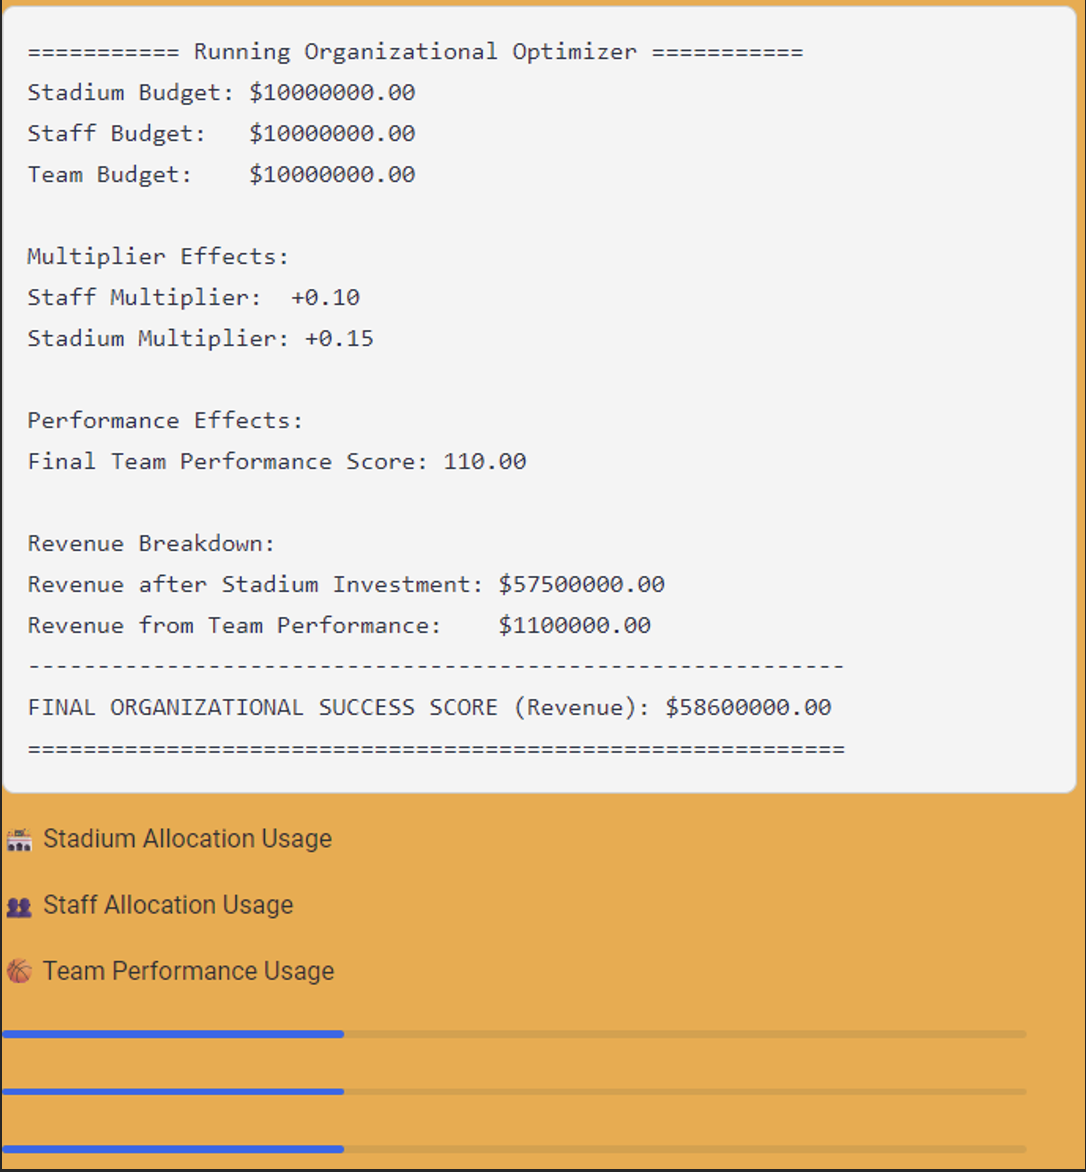
- Users allocate a $30M budget across Stadium, Staff, and Team Performance.
- Linear programming determines final team performance and revenue based on multipliers.
- Progress Bars:
- Visualize each budget category proportionally against the total $30M budget.
- Dynamically update when users enter new values, showing which areas dominate their allocation.
- Helps users understand trade-offs instantly.
3. Progress Bar Example:
Reflection
- Learned: How to integrate OR-Tools with Vaadin, manage dynamic data, and visualize allocations effectively.
- Contributions: Implemented the OrgOptimizationSolver logic, and designed the progress bar visualizations.
- Growth: Gained confidence in OR modeling, frontend and backend integration, and presenting complex data in an understandable way.
How Users Interact
- Enter budgets for Stadium, Staff, and Team Performance (in millions).
- System checks that total does not exceed $30M.
- OR solver calculates multipliers and final success score.
- Results displayed as text and visualized with progress bars.
- Users can immediately see trade-offs and adjust budgets.